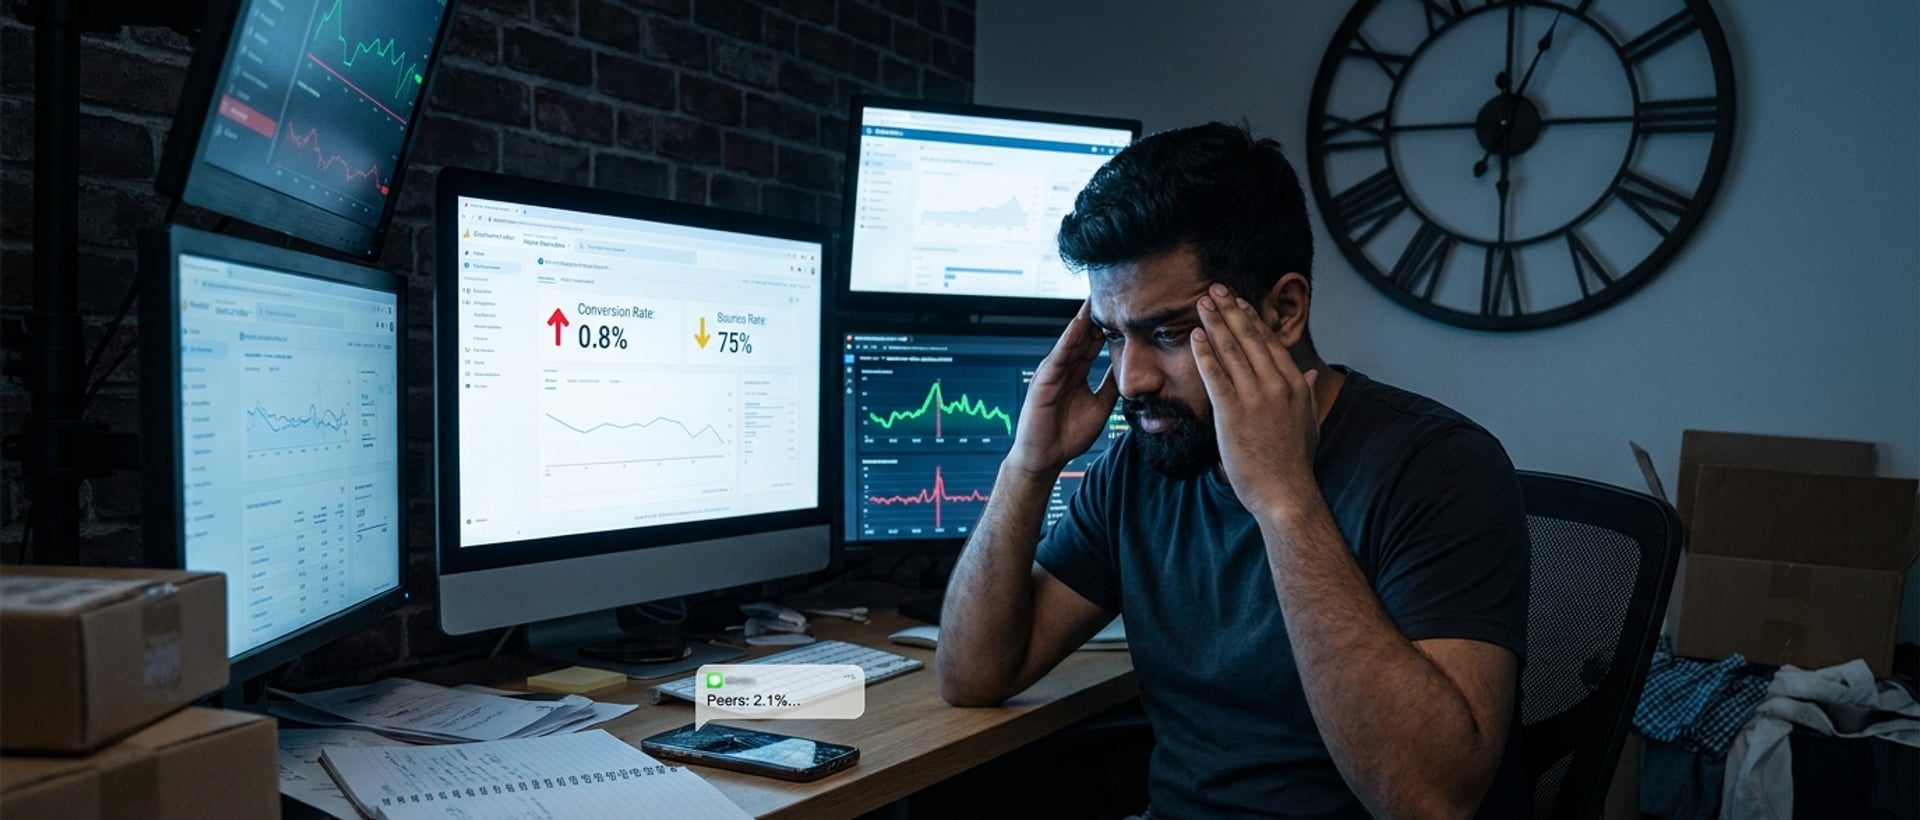
Your Meta ad account is spending ₹80,000 a month. GA4 shows the sessions are coming - 30,000 monthly visitors, decent time-on-page, click-through to PDP looks fine. The PDPs get viewed. The add-to-cart happens. And the orders don't come. Your conversion rate is 0.6 percent. The founder in your WhatsApp group who runs a similar brand is at 2.1 percent. What's actually wrong?
Almost never one thing. Nine specific things. All of them small. Most of them fixable in 6-10 weeks. And most of them get missed because the conversation about "why aren't sales coming" defaults to "we need more traffic" or "the product isn't resonating" - both of which are usually not the real problem.
This post is the leak-detection framework. What actually stops the sale between "customer clicked the ad" and "customer paid for the order," ranked by frequency of occurrence in Indian D2C audits. Fix the top three and most brands see a 20-40 percent conversion lift inside 8 weeks.
What's the honest split - is it a traffic problem, a conversion problem, or a product problem?
Quick Answer: Diagnose before you fix. Split GA4 by traffic source. If direct + branded search converts 2-3x higher than paid social, the paid social traffic is low-intent (targeting problem, not conversion problem). If ALL sources including direct convert poorly, the site or offer is the problem. If mobile converts less than 50 percent of desktop, it's a mobile experience problem. Diagnosing wrong wastes budget. Almost all "traffic but no sales" cases in Indian D2C are 60-70 percent conversion problem, 20-30 percent traffic-quality problem, under 10 percent product problem.
The specific fastest diagnostic is a 30-minute GA4 audit. Open GA4, filter to Sessions by Source/Medium for the last 30 days. Add Conversion Rate as a metric. If your best converting source is 3x the worst converting source, the leak is upstream (traffic quality). If everything converts within a narrow band and all bands are low, the leak is on the site (conversion).
The mobile-versus-desktop split is the second fastest test. Same GA4, add Device Category. If mobile is significantly under desktop conversion (say 0.6 percent mobile vs 1.8 percent desktop), the mobile experience is bleeding. Given 78 percent of Indian ecommerce traffic is mobile, this specific leak is usually the biggest single revenue impact when unfixed.
What are the 9 specific conversion leaks in Indian D2C sites?
Quick Answer: Ranked by frequency across our audits - (1) mobile PDP load speed above 3 seconds, (2) reviews missing or hidden on PDPs, (3) shipping cost surprise at checkout, (4) COD/prepaid unclear pre-checkout, (5) returns policy hidden or missing, (6) size/fit guidance missing, (7) checkout requiring account creation, (8) trust signals absent (no About, no contact, no address), (9) WhatsApp support call-to-action missing on PDP. Almost every under-converting Indian D2C site has 5-7 of these simultaneously.
Leak 1 - mobile PDP load speed. According to product page SEO benchmarks, a 1-second delay in page load time can lead to a 7 percent reduction in conversions. In Indian mobile context on 4G, a PDP that loads in 4.5 seconds converts roughly 20-25 percent lower than one that loads in 2.5 seconds. Fix - image compression, lazy loading below fold, cutting third-party scripts, aggressive caching. Usually a 12-20 hour dev job, biggest single conversion lift.
Leak 2 - reviews missing or hidden. Products with under 10 visible reviews convert 20-40 percent worse than same product with 15+ reviews. Fastest fix - WhatsApp review requests to customers 7 days post-delivery (WhatsApp response rate is 4-6x email). Ship the review layer on PDP prominently above the fold on mobile, not buried in a tab. Aim for 15+ reviews on your top 20 SKUs first.
Leak 3 - shipping cost surprise at checkout. Customer sees ₹999 product, adds to cart, sees ₹150 shipping added, abandons. Free shipping threshold displayed clearly on PDP fixes this - "Free shipping on orders over ₹1,500" prompts basket-building instead of abandonment. Or absorb shipping into product pricing and market as "free shipping."
Leak 4 - COD/prepaid unclear pre-checkout. Indian customer wants to know upfront whether COD is available for their pincode. Sites that force them to add to cart and enter address before revealing COD availability lose the customer at that reveal. Fix - a pincode-check widget on the PDP that shows COD/prepaid availability and expected delivery date before add-to-cart.
Leak 5 - returns policy hidden or missing. First-time buyers explicitly look for returns/refund policy before ordering. If it's in the footer only, or written in legal English, it's not doing its job. Fix - a plain-English "30-day returns" or "no questions asked" line on the PDP, plus a clear Returns page linked from the header. This alone lifts trust-conversion 8-15 percent.
Leak 6 - size/fit guidance missing (apparel/footwear specifically). Indian customers historically buy fewer variants than US/EU counterparts partly because of return friction. A clear size chart with body measurements, plus a "how does it fit" tag on each SKU (relaxed/regular/slim/oversized), reduces size-related returns AND lifts pre-purchase conversion.
Leak 7 - checkout requiring account creation. Every additional field between cart and pay drops conversion 5-10 percent. Guest checkout with optional account-creation-post-purchase is the correct default. Force-account-creation costs 20-30 percent of first-time buyer conversion.
Leak 8 - trust signals absent. No About page, no team photos, no physical address, no support phone number, no company registration details. First-time buyers checking whether you're legit see nothing and bounce. Fix - a proper About page with real team + real address, footer with GST number + registered address, contact page with phone + email.
Leak 9 - WhatsApp support call-to-action missing on PDP. The Indian customer's default resolution mode is WhatsApp. A prominent WhatsApp chat button on PDP with instant response captures pre-purchase questions that otherwise become abandoned carts. Cost - free (WhatsApp click-to-chat) to ₹1,500/month (managed WhatsApp Business).
Which leak should you fix FIRST if you can only fix one?
Quick Answer: Mobile PDP load speed for almost every Indian D2C brand. This one leak fixes multiple downstream failures simultaneously - faster PDP improves Core Web Vitals (which improves search ranking), improves mobile UX (which improves conversion), improves Meta ad quality score (which reduces CPM), and improves bounce rate on all mobile traffic. Fixing one thing to fix five is the best ROI in this list. Usually 12-20 hours of dev work; measurable lift within 2-4 weeks.
The mechanical reason mobile PDP load speed compounds is that page speed is now an input to multiple downstream systems, not just user experience. Google Search ranking includes Core Web Vitals as a signal. Meta ad relevance algorithm includes landing-page speed. Your own ad account CPM lowers when landing pages score higher. Any one of these is a benefit; combined, the ROI is 3-4x what a single conversion-only fix would deliver.
The specific numbers to target - Largest Contentful Paint under 2.5 seconds, Time to Interactive under 3.8 seconds, Cumulative Layout Shift under 0.1. Test with Lighthouse on Chrome for Android on a throttled 4G connection (not desktop, not fibre - real Indian mobile conditions). Anything failing these thresholds is a leak.
Cost of fixing mobile PDP speed on a Shopify site typically breaks down as - image optimisation (3-5 hours, use tools like ShortPixel or Squoosh), lazy-loading (2-3 hours), removing unused third-party scripts (4-6 hours audit and cleanup), theme code cleanup (4-8 hours). Total 12-22 hours. Cost - ₹15,000-40,000 with a competent developer.
What's the honest conversion lift you should expect from fixing the top 3 leaks?
Quick Answer: For a typical Indian D2C brand starting from 0.8-1.2 percent conversion rate, fixing the top 3 leaks by traffic impact typically lifts total conversion 20-40 percent within 8 weeks. Below 20 percent lift and either the diagnosis was wrong or the fixes were incomplete. Above 60 percent lift and either you had extreme starting-baseline issues or you're measuring wrong. Manage expectations - conversion optimisation is compounding small wins, not a 3x jackpot.
The specific pattern of lift shows up as a compound of small percentage improvements. Mobile speed fix adds 8-12 percent. Reviews visibility adds 5-10 percent. Shipping transparency adds 4-8 percent. Compounded, that's roughly 20-35 percent net conversion lift. For a brand doing ₹1 crore monthly at 1 percent conversion, that's 200-350K additional monthly revenue at zero incremental ad spend.
Setting realistic timeline expectations matters. Individual fixes ship in days. Attribution of lift takes 2-4 weeks of new data. Sequential prioritisation (fix, measure, then next fix) works better than parallel (fix everything, can't tell what worked). Founders who want instant "test 5 things at once and see what worked" usually cannot statistically distinguish the effects and end up doing more iteration than needed.
For most Indian D2C brands, this is one part of a broader operational upgrade - the conversion lift on the front end pairs with the operational reliability on the back end. Both compound. Neither alone delivers the full opportunity. See our Shopify vs custom breakdown for the platform-level context.
What should you do next?
Run the 30-minute GA4 diagnostic first. Split conversion by source and by device. Identify whether you have a traffic-quality problem or a site-conversion problem. Don't skip this - fixing conversion when your problem is traffic wastes 8 weeks. Fixing traffic when your problem is conversion wastes ad budget.
Then run the 9-leak audit against your top 5 PDPs. Open each on your phone (not desktop). Time the page load. Note whether reviews are visible above the fold. Try adding to cart and see if shipping cost surprises. Check the checkout for account-creation forcing. Log each of the 9 leaks as present or absent. Score your site out of 9.
Then pick the top 3 leaks by traffic-share impact - the ones affecting the most sessions, not just the ones easiest to fix. Sequence the fixes across 6-10 weeks. Measure lift week-over-week from week 3 onward as the changes accumulate GA4 data.
If you want an outside audit against your specific PDPs, traffic mix, and current conversion rate, book a conversion audit - we come back with your specific 9-leak score, the priority sequence, the expected lift range, and either a done-with-you or done-for-you fix plan. Not a generic listicle. Your specific leaks in your specific site.